
Product case study macOS apps 2026
Core Metrics
Your Mac’s readings. In the menu bar.
CPU, memory and startup-volume statistics, close to the work you are already doing. Core Metrics is a native macOS utility that lets you choose the readings you need and how they appear.
Visit the app websiteBranding
A visual identity built around the readings.
The icon uses three silver, rounded bars against graphite. The same restrained palette carries into the release artwork: a silver canvas, large black headings and genuine dark-appearance app surfaces. Each panel introduces one concrete idea—selecting statistics, choosing a style or understanding a reading—before showing the controls that support it.
Core Metrics
App Store artwork colors
- Silver
- #E7E8EA
- Graphite
- #17191C
Native typography
System text and tabular digits keep changing values easy to scan.
Quiet contrast
Silver and graphite leave the information at the centre of the composition.
Real product imagery
The artwork uses captured Settings and Metric Help screens.
App views
A closer look.
From choosing your statistics to understanding each reading. App Store images show the English Mac interface.
Images 1 / 3
Select an image to view the full-size artwork.
The brief
Useful information, one glance away.
Core Metrics is for people who want to keep an eye on their Mac’s current resource use while working. It places selected readings in the menu bar, where they remain close without occupying a separate monitoring window. Click the readings to open a selection panel, then choose the information that matters to you.
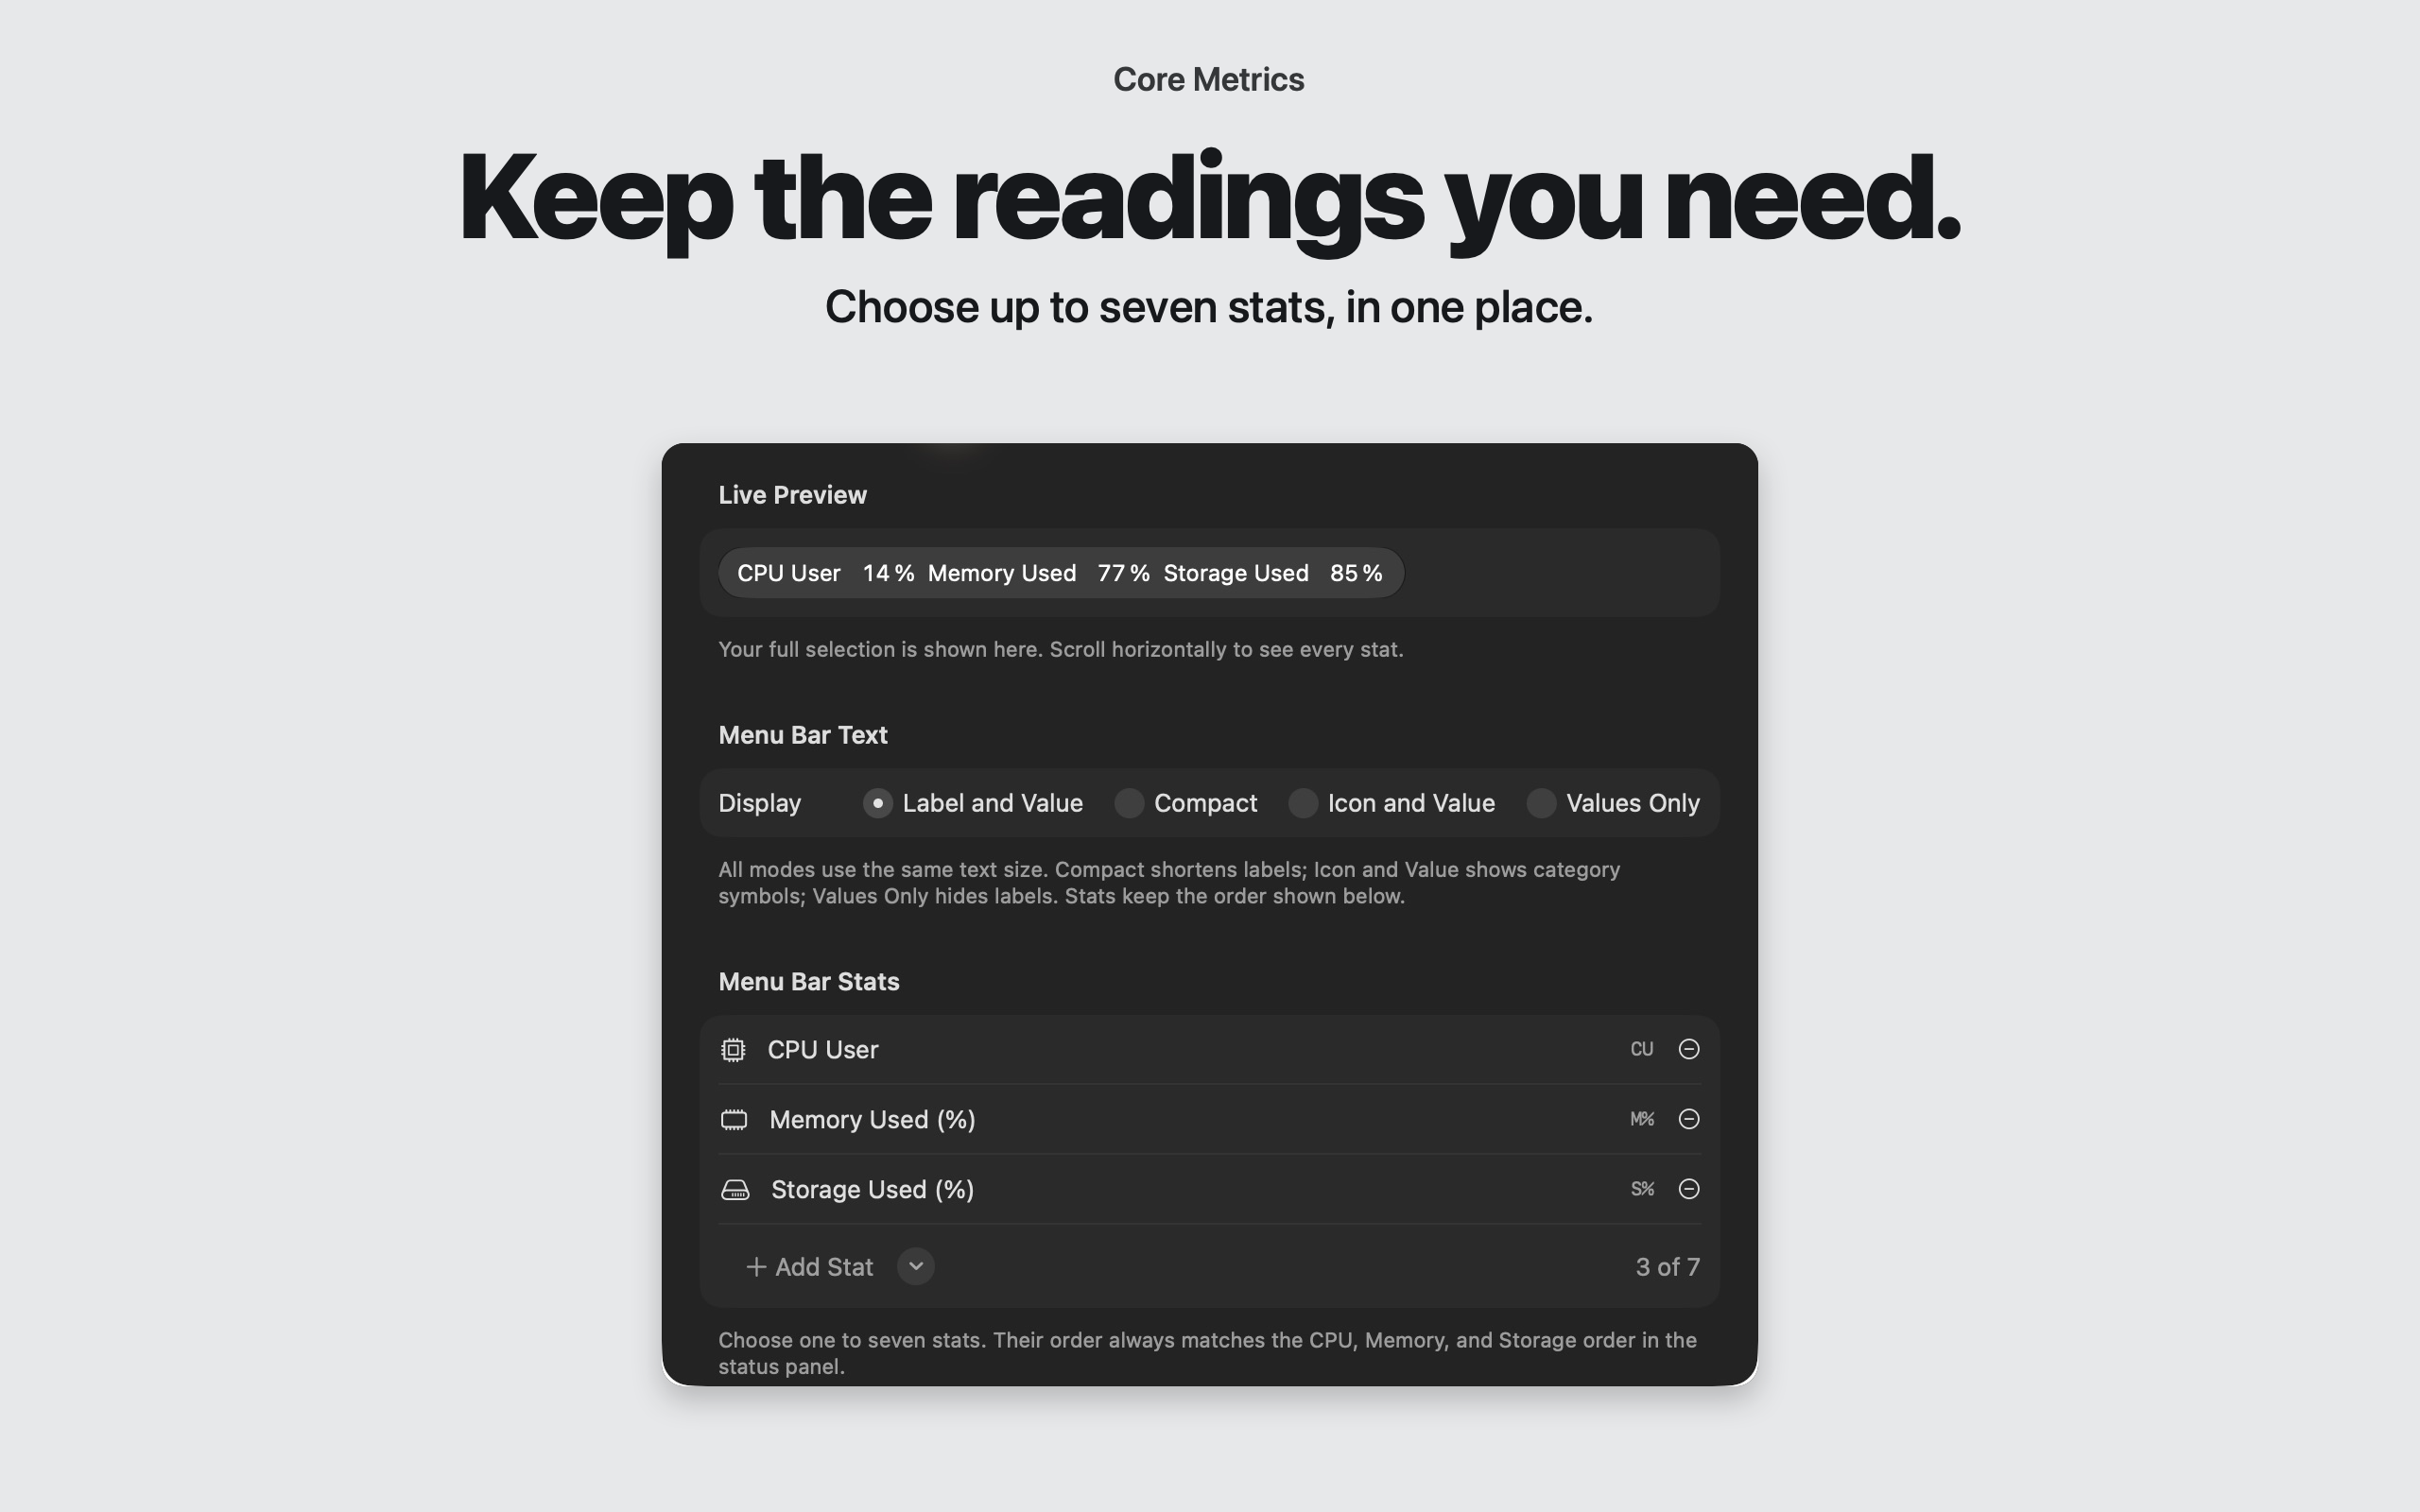
The panel groups 15 statistics into CPU, Memory and Storage. It stays open while you change choices, and you can select several statistics from one category. One to seven readings remain selected, always in the same category order. Your selection and display style are saved locally for the next launch.
- Platform
- macOS 27+ · Apple silicon
- Selection
- 1–7 of 15 statistics
- Display
- 4 native styles
- Interface
- English · Localized numbers
How it works
From first launch to your own view.
The app opens in the menu bar. There is no Dock icon or main application window.
Find the first reading
Launch Core Metrics and look for CPU User in the menu bar. Allow a few seconds for the initial CPU sample, then click the reading to open the selection panel.
Choose your statistics
Use the CPU, Memory and Storage checkboxes. The panel stays open while you adjust the selection; at least one and at most seven statistics can be enabled.
Set the display style
Open Settings to choose a style, add or remove statistics and inspect Live Preview. Scroll the preview horizontally to see the full selection when it is wider than the window.
Copy a current snapshot
Choose Copy Readings in the panel to put full selected names and current values on this Mac’s clipboard. Copying replaces its previous contents; the button confirms success with Copied.
Make startup optional
Enable Launch at Login in Settings if you want the app to open when you sign into macOS. The system manages registration and any approval separately from menu-bar preferences.
In detail
Fifteen statistics. Four ways to read them.
CPU across all cores
CPU readings are normalized across all cores to 100%. Used equals User plus System; Idle is 100% minus Used. These are aggregate readings, without individual process or per-core lists.
Memory with context
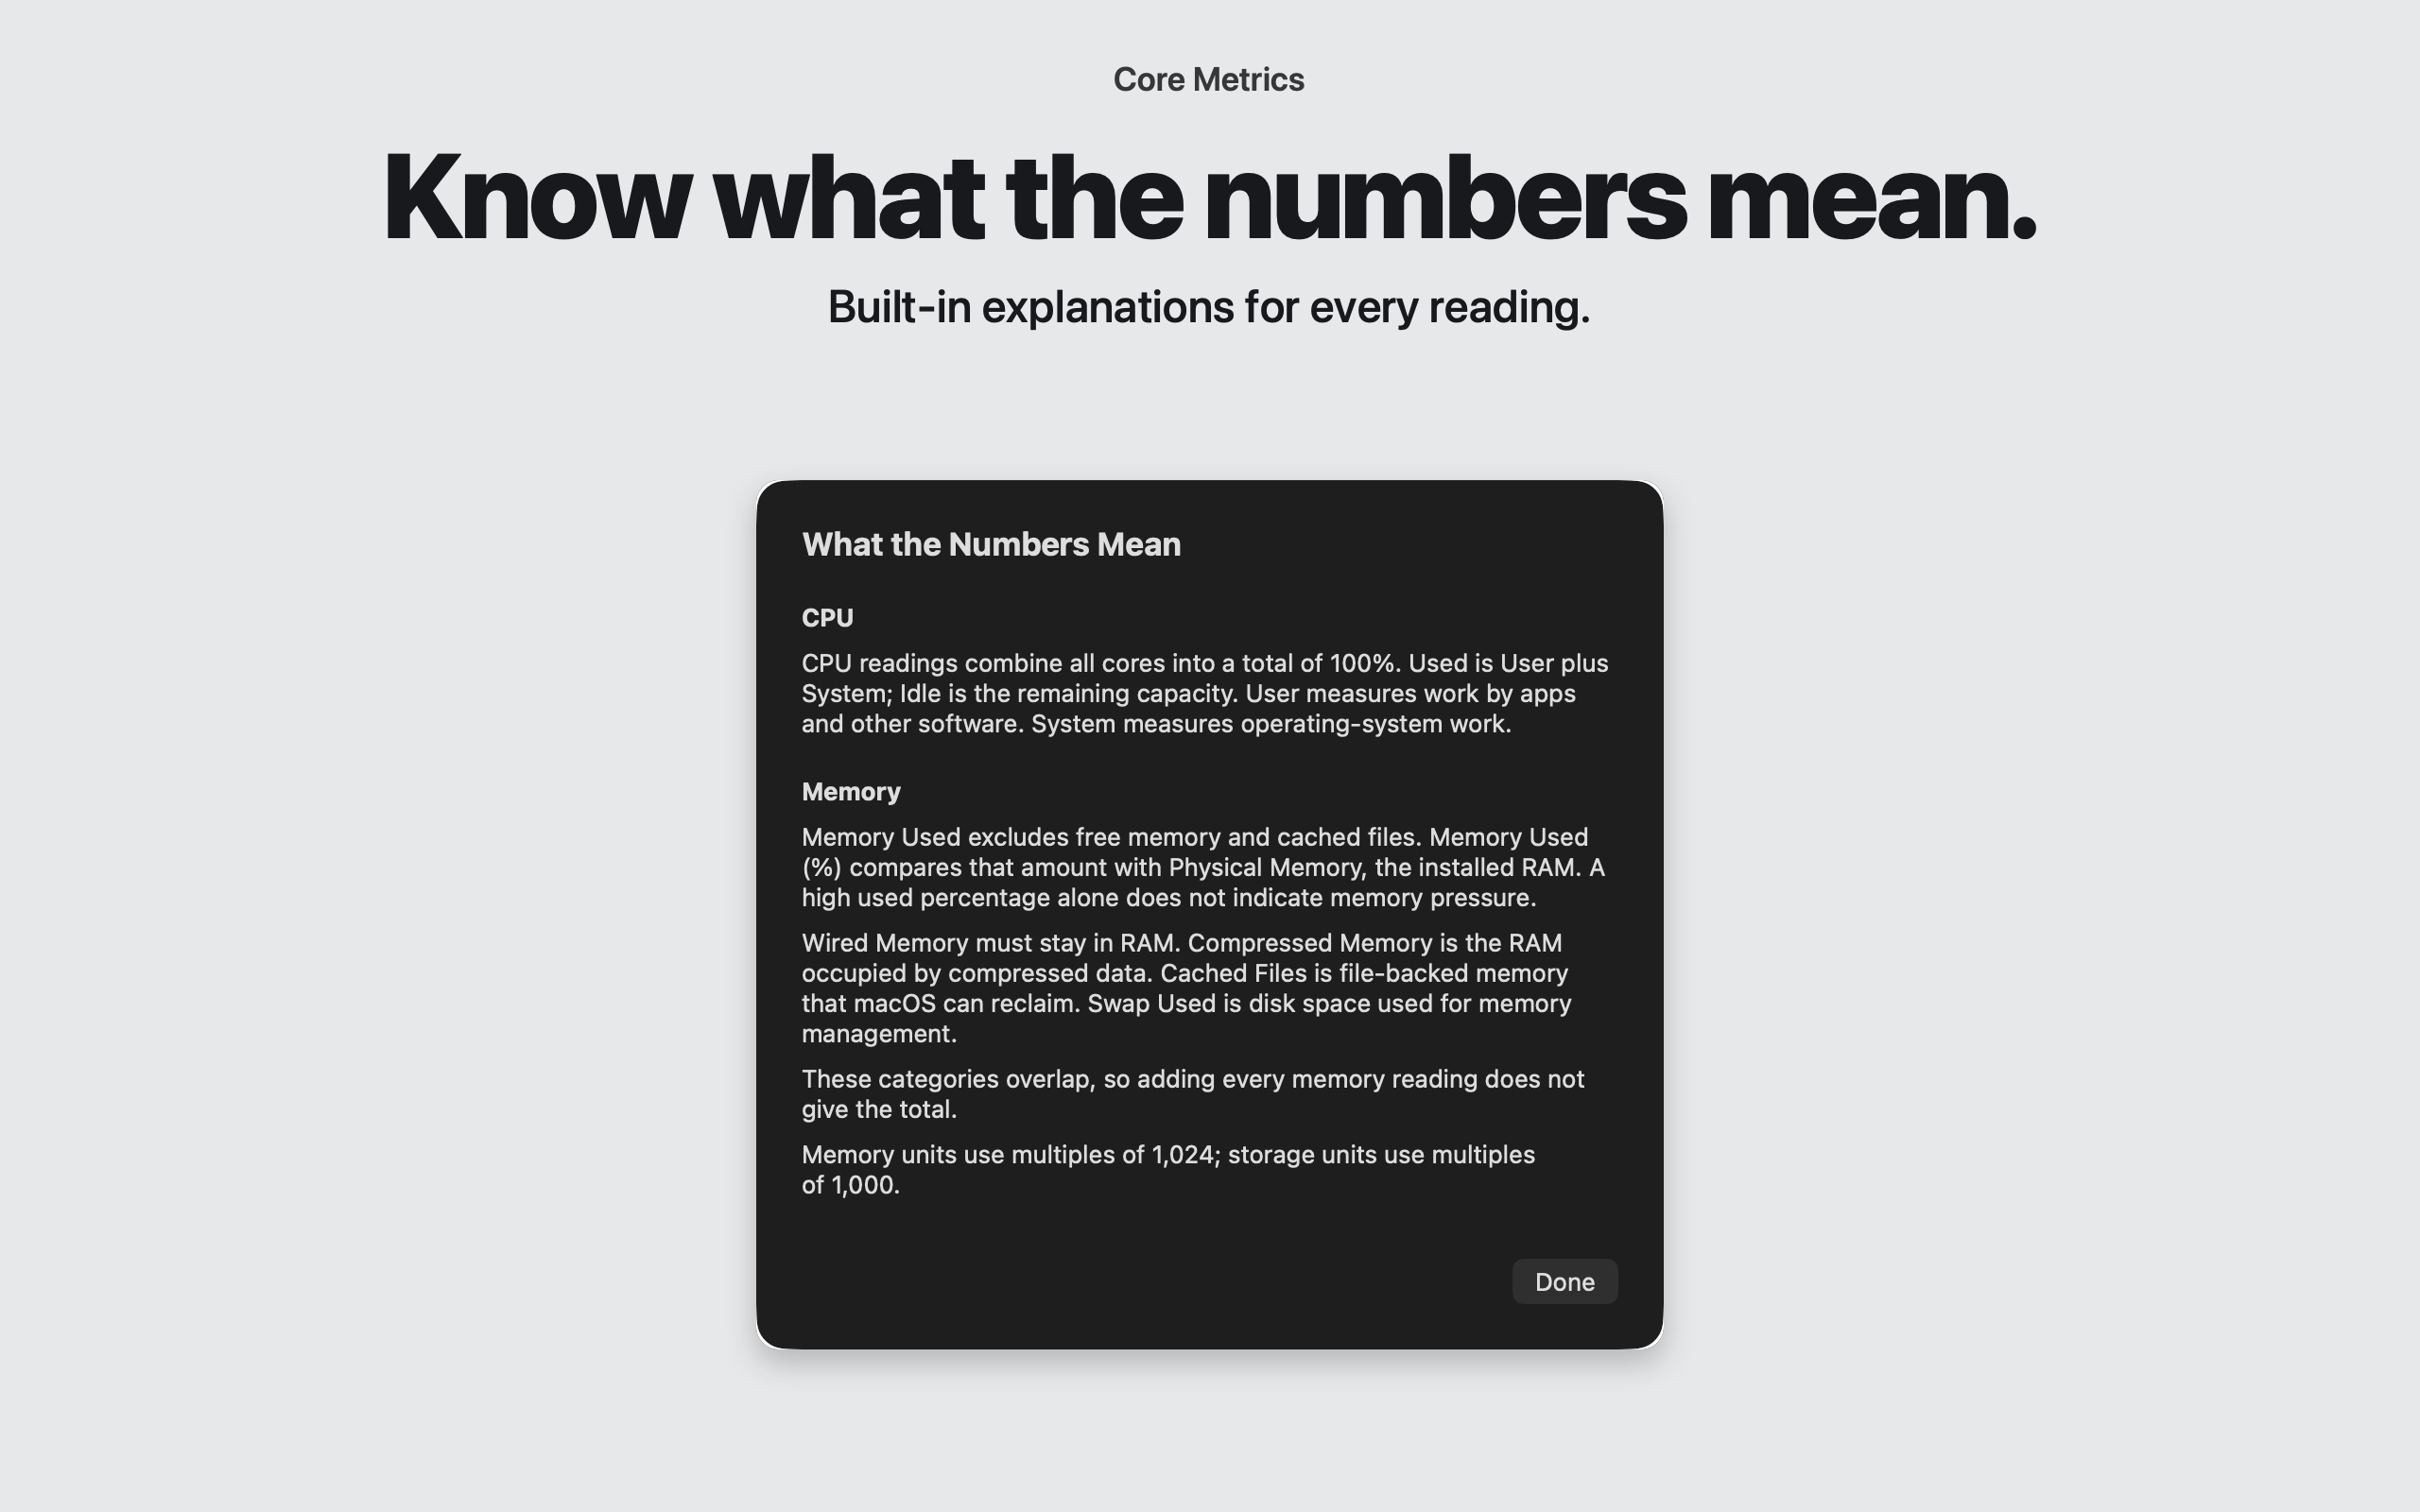
Memory Used, Memory Used (%), Wired Memory, Compressed Memory, Cached Files, Swap Used and Physical Memory describe different aspects of memory management. Used excludes free memory and cached files. The categories overlap, and a high used percentage alone does not establish memory pressure.
Startup-volume storage
Storage Used, Storage Used (%), Storage Free and Storage Total describe the startup volume. Free space comes from the file system and can differ from Finder estimates that include reclaimable space. The app does not scan files or classify storage.
Your preferred representation
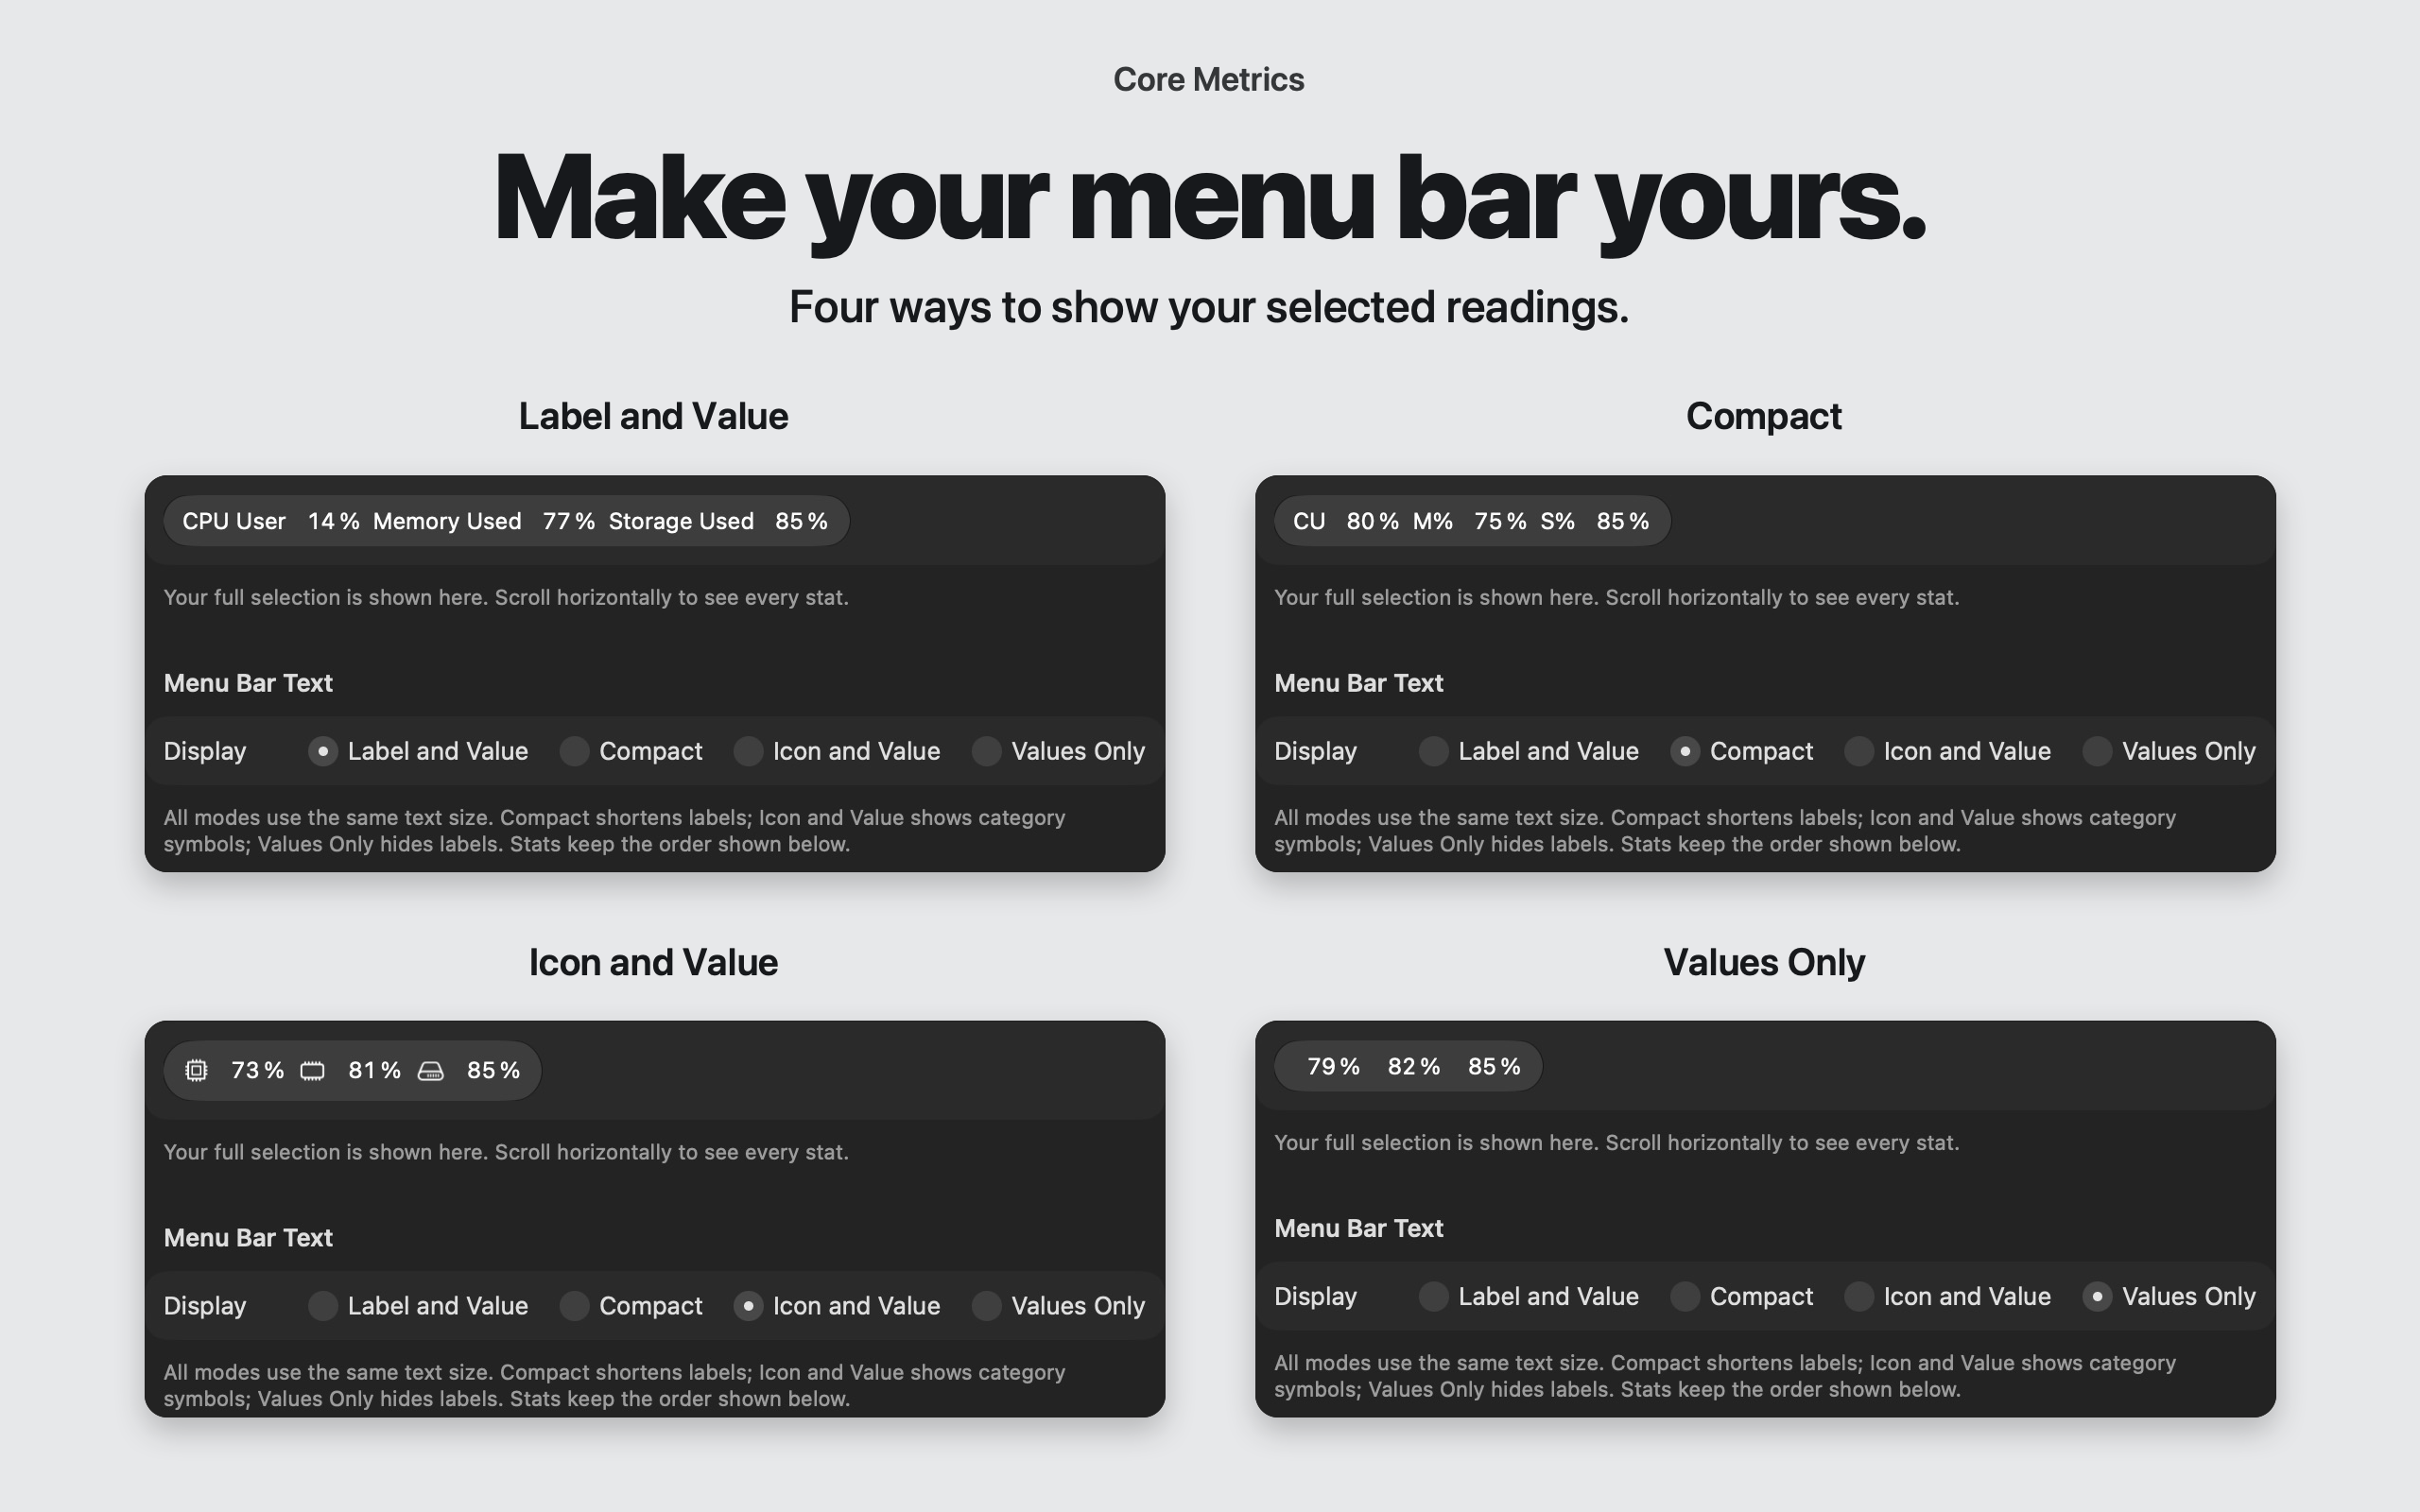
Label and Value shows full names; Compact abbreviates them; Icon and Value adds category symbols; Values Only shows numbers and units. All four support every selection count and use the same native text size. Compact saves space through shorter labels.
The challenge
Useful information. Very little room.
The Mac menu bar is shared space. A monitoring tool has to earn its place alongside the apps a person already uses. Showing every available reading would compete with their work, while a single fixed value would leave different needs unmet.
The product challenge was to give people a meaningful choice without making them manage a monitoring system. We limited the scope to CPU, memory and startup-volume storage, then made the display configurable. Clear explanations matter as much as the numbers: high memory use alone does not mean a Mac is struggling.
We designed and built a native Mac utility around a narrow brief: keep useful system readings visible without turning the menu bar into a dashboard. Core Metrics brings product definition, a restrained identity, native controls and local measurement into one configurable status item.
One status item, a deliberate selection
Fifteen available statistics become a selection of one to seven. A single menu-bar item keeps them together; the popover and Settings expose the same choices. The product offers breadth through configuration while keeping its everyday surface small.
Shorter labels, consistent text size
Four display styles trade labels for abbreviations, icons or values. They preserve the same native text size. Live Preview shows the complete selection, so a person can judge the result before closing Settings.
Explain the reading at its source
Metric Help explains each statistic and its limits beside the selection controls. Missing measurements use a dash. The interface avoids presenting a failed sample as a reassuring zero or treating overlapping memory categories as a simple total.
The build
Native behaviour, carefully owned.
AppKit owns the menu-bar item and popover; SwiftUI supplies the selection controls and Settings. Small providers read public Apple system APIs, and separate calculators validate the measurements. Measurements are collected separately from interface updates so sampling does not block interaction.
Locale-aware text measurement reserves space for each configuration. Changing values update the label without changing that allocation; selecting different statistics or styles can resize it. The app is sandboxed and uses no third-party dependencies. Only display preferences persist: current measurements stay in memory, with no accounts, app network connections, analytics or advertising.
The result
A small utility with a clear boundary.
The resulting app combines a configurable menu-bar display, a selection popover, Settings, Metric Help and a copyable snapshot. Its graphite icon and silver bars give it a recognizable identity, while AppKit and SwiftUI keep the everyday interaction native.
Its usefulness comes from current, local information. Display preferences persist, while measurements stay in memory. History, process management and remote monitoring are outside this product’s scope.
Good to know
Small details that make daily use clearer.
Current readings and clear gaps
CPU and memory refresh about every two seconds, storage about every thirty. A dash means unavailable. CPU needs a new baseline after launch or a sampling gap; swap can be unavailable while other memory readings remain valid.
Help inside the product
Metric Help explains the readings and their limits. Memory units scale by 1,024; storage by 1,000. Restore Defaults selects CPU User and Label and Value without changing Launch at Login.
A route back to Settings
Available menu-bar space depends on your Mac and other items. If a long selection is hidden, open the already-running app again from Finder to bring Settings forward, then choose fewer readings or a narrower style.
A few useful answers.
Which Macs does Core Metrics support?
It requires macOS 27 or later on a compatible Apple silicon Mac. The app interface is in English; numeric formatting follows the Mac’s locale. There is no iPhone, iPad or Windows version.
Does it keep graphs or export a history?
No metric history or charts are retained. Copy Readings copies only the currently selected names and values as text. There is no CSV or historical export. Copies are excluded from Universal Clipboard; anything you paste into another app is handled by that app.
Does it need an account or administrator access?
No account, privileged helper or administrator access is needed. Core Metrics reads aggregate values locally through public system APIs. It has no purchases or subscriptions. Optional Launch at Login follows macOS registration and approval.